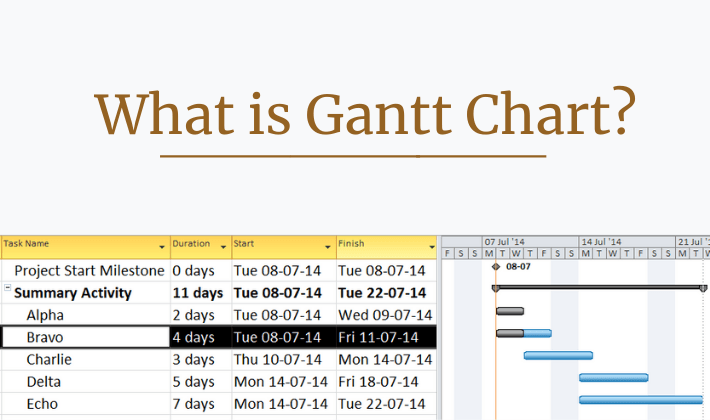
What Is the Definition of a Gantt Chart
A Gantt chart is a graphical tool used to display the start and end dates of specific tasks as well as their duration. Gantt charts are often used in project management to help organize and track tasks. It is used to visualize the start and end dates of tasks, as well as the dependencies between them. Now that you know the Gantt chart definition, you can create your own for different projects and ensure you meet deadlines. Please keep reading to learn about the benefits of using this chart type and when to use it.
Benefits of Using a Gantt Chart
A Gantt chart is a graphical representation of a project schedule. It uses bars to illustrate the start and finish dates of tasks, as well as their durations. This makes it easy to see how tasks relate to one another and how the project is progressing. There are several benefits of using a Gantt chart. It helps you to plan and track your project. The chart makes it easy to identify and resolve conflicts between tasks. It shows you how much of the project has been completed and helps you to estimate the duration of the project. And it makes it easy to identify the critical path of the project.
Best Practices for Creating Gantt Charts
There are many different ways to create and utilize Gantt charts. However, there are some general best practices that can help you get the most out of your Gantt chart. The first step in creating an effective Gantt chart is to plan ahead. Make sure you understand the project you are trying to chart and have a clear idea of what you want to achieve. Similarly, it is important to start with the end in mind. Know what you want the Gantt chart to tell you and what you want to be able to do with it. The next step is to create a detailed task list. This will form the basis of your Gantt chart and will help you to visualize the project timeline.
When creating your Gantt chart, use a variety of colors to denote different tasks and phases. This will make it easier to visualize the project at a glance. If you want to focus on deadlines, you can invert the chart to show them as red bars on the top. This will help you to quickly and easily see which tasks are due soon. Lines can be used to show dependencies between tasks. This will help you to see how tasks are related and identify potential bottlenecks. You may also want to add notes and comments to your Gantt chart. This can help to further clarify the project timeline and the tasks involved. By following these best practices, you can create an effective Gantt chart that will help you to visualize and manage your project timeline.
Disadvantages of a Gantt Chart
There are a few disadvantages of using a Gantt chart when managing a project. One is that it can be time-consuming to create and update. Additionally, it can be difficult to track multiple tasks and dependencies on a Gantt chart. Additionally, the chart may not be effective if the project is very complex or has a lot of dependencies.
When to Use a Gantt Chart
A Gantt chart is a graphical representation of a project schedule. It is used to show the relationship between tasks and their duration. You should use a Gantt chart when you need to track the progress of a project when you need to identify the critical path of a project, when you need to schedule resources, or when you need to communicate the status of a project.


