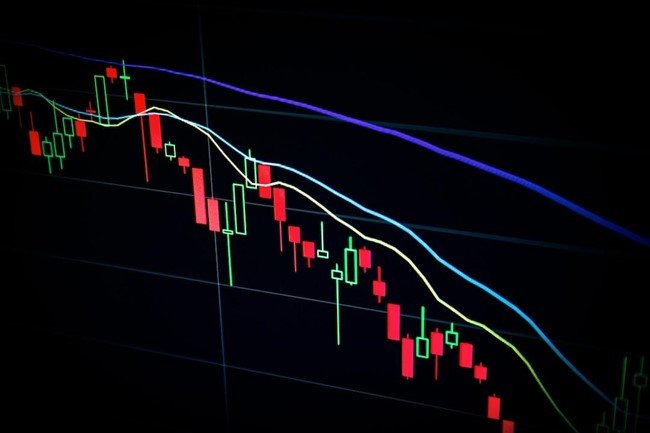
Mastering Candlestick Chart Analysis: Spotting Trends and Patterns
The world of stock trading can seem like a labyrinth where cryptic codes tell stories of corporate fortunes. Among the varied tools and techniques that traders have at their disposal, candlestick charts bear an inimitable significance. Acting as a graphical representation of price movements, they communicate a trove of information that, if properly analyzed, can accord an edge to the trader. Keep reading as we delve into the depths of candlestick chart analysis.
Understanding Candlestick Charts
The candlestick chart originated in 17th-century Japan and was utilized for tracking the price changes in the rice trade. The uniqueness of this chart lies in its ability to vividly illustrate the battle between buying and selling orders in a given period. Each candlestick in the chart represents information on the open, high, low, and close prices for the chosen time frame.
A candlestick primarily consists of two elements: the “body,” which represents the range between opening and closing prices during a particular time period, and “shadows,” or “wicks,” that stretch beyond the body and represent highs and lows. The color of the candlestick body assists in distinguishing between bullish (price rising) and bearish (price falling) market conditions.
Anyone stepping into the world of financial trading, especially day trading, will find the candlestick chart an inseparable part of their toolkit. Despite its seemingly complex appearance, the candlestick chart provides traders with vital information at a glance, making it a preferred price visualization tool in comparison to other charts like bar charts or line charts.
Identifying Candlestick Patterns
Candlestick patterns act as a valuable predictor of potential price reversals and can create trading opportunities. These patterns consist of a single or group of candlesticks. Examples of single candlestick patterns include the Doji, Hammer, and Spinning Top, while popular multiple candlestick patterns include Bullish Engulfing, Bearish Engulfing, Morning Star, and Evening Star.
While a single Doji candle might indicate indecisiveness in the market, a series of them may suggest a turning point or trend. The Hammer, on the other hand, is identifiable by a short body, a lower shadow twice the length of the body, and little to no upper shadow. It signifies a potential bullish reversal. The Spinning Top entails a small real body with longer upper and lower shadows, indicating strong disagreement between bulls and bears.
Multiple candlestick patterns contain greater credibility as they capture more market sentiment compared to their single counterparts. The bullish engulfing pattern, for example, faces a lesser possibility of deception as it signifies a potential reversal pattern occurring during downtrends. Meanwhile, the Bearish Engulfing pattern signifies the opposite, followed by the Morning Star, which predicts the dawn of an uptrend, and the Evening Star foretelling an upcoming downtrend.
Benefits of Candlestick Chart Analysis
When it comes to stock trading, information is gold. Candlestick chart analysis provides traders with insights that might not be gathered from other charting systems. Notably, it depicts market sentiment, indicating bullish or bearish conditions. These charts also display significant price levels, letting traders know at what price levels the market reacted previously. This knowledge can assist traders to position their entries better and manage risks efficiently.
One of the major advantages of using candlestick charts is that they make it straightforward to identify patterns in the price data that can hint at future activity. Patterns on candlestick charts provide more visually identifiable information than other kinds of charts, which can result in quicker and more informed trading decisions.
Finally, mastering candlestick chart analysis can potentially heighten one’s chances of trading success. By providing a plethora of information through a single candlestick, these charts facilitate informed trading decisions. An understanding of how to read trading patterns further allows traders to anticipate future price movements with greater accuracy than most other methods.
While learning how to read candlestick charts can seem overwhelming at first, the effort can yield unparalleled benefits for interpreting the behavior of the stock market. Understanding the basic structure of a candlestick chart and recognizing critical patterns can prove to be invaluable knowledge for any trader.


